 Menu
Menu
Menu
Menu
Linnard Financial Management & Planning, Inc.
Fee-Only Financial Planning and Investment Advisor
July 1, 2024
Indexes are everywhere. For over a century, investors and market participants have closely watched them to help them understand the general tenor of the markets and to help them evaluate the potential for a successful investment. These days, it is possible that indexes not only measure the markets, but also influence it. Sometimes when these measurements uncharacteristically differ from each other, it can be a sign that conditions may change
Speaking of indexes, the economic data we watch are just that. They are a series of data points that measure the current level of economic activity and suggest how the trend may be changing. A major index, the Gross Domestic Product, produced an annual real growth rate of 1.3% during the 1st quarter. Highly variable current estimates are about 2% now. These readings have not been recessionary, but neither are they great as we get closer to the exit of the post pandemic government spending spree that balanced out the Federal Reserve’s tight monetary policy. Another index, unemployment, at 4% is still at one of its lowest values going back to the 1950s. Meanwhile, indexes that measure housing suggest unsold inventory is rising, but so are prices. Affordability remains a challenge for many people due to higher interest rates. The Consumer Price Index has stabilized around 3%, which is historically very normal. The Index of Leading Indicators continues to fall, suggesting that there is still a likely recession in our future.
After correcting in April, the cap-weighted S&P 500 index has reached new highs, while an equal-weighted version was down about 1% during the quarter, producing a difference of about 6% in the reading of these two indexes. These indexes are both composed of the same stocks. “Which is real? Which should I rely on?” would be valid questions.
During the same period, intermediate term treasury bonds moved higher but are still slightly below where they started the year. The indexes show that short-term debt continues to outperform the longer duration variety, but strengthening in longer term bonds may be at hand if the Fed decides to end its higher interest rate regimen.
The original stock index was created in 1884 by Charles Dow. It began as a simple average of the prices of eleven mostly railroad stocks. Twelve years later, the Dow Jones Industrial Average was created with 12 stocks. It later expanded to 30. Creating a simple average of prices made sense in the days before computers, but the method has the side-effect of giving more arithmetic importance to higher-priced stocks. Hence it is called a "price-weighted" index. That was not important at the time, as it fulfilled its primary function as a barometer of the stock market.
The S&P 500 index evolved during the period from 1926 to 1957, using a more complicated mathematical technique. The values in this index are cap(capitalization)-weighted according to the total market value of the company’s shares. This technique gives greater weight to larger companies and better reflects the overall value of equities in the economy. Its purpose is the same though; to provide a sense of how equity prices are changing.
Recent financial engineering has vastly expanded the importance of the indexes and how they are calculated. Financial futures and options contracts based on the indexes were developed so that investors could place or hedge bets on stock market and other investments. But mutual fund managers’ performance was judged by how their funds performed versus the S&P 500. This prompted at least some of them to try to duplicate the index performance, lest they be criticized for poorer comparative performance. This trend evolved into the creation of index funds and exchange traded index funds that have the explicit goal of duplicating an index. Merely buying the stocks of a pre-defined index was also cheaper administratively than “stock-picking”. As more and more money followed the index approach, indexes have proliferated to include just about every corner of the investment world, from semiconductors to timber and stocks from Singapore.
A funny thing happened during this evolution though. Although indexes were developed to report on the market, they essentially became the market, especially for individual investors. Index funds are an appealing alternative to individual stocks, since they provide greater diversification and are the staple offering of employer-based retirement plans. Because most are cap-weighted, more of every new dollar goes into the most heavily weighted stocks in the index. As this occurs, their weights increase more, and even more of the next dollar is allocated to them. Thus new investments continued to be allocated more to ever higher valued companies, which is the opposite of normal investment wisdom. Because of this “buy higher” effect, over the years better returns generally come from smaller companies, except during periods of economic stress when smaller companies are more risky. Since 2009 an equal weighted version of the S&P has out-performed the cap weighted version - until recently (green rectangle).
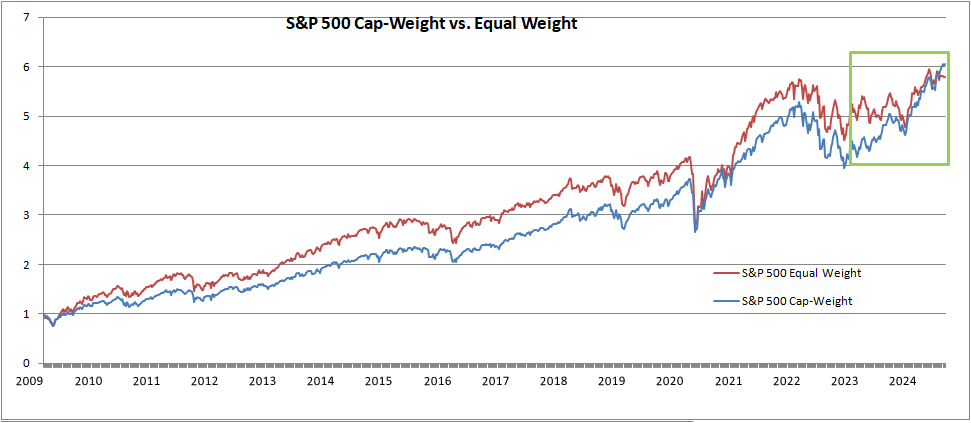
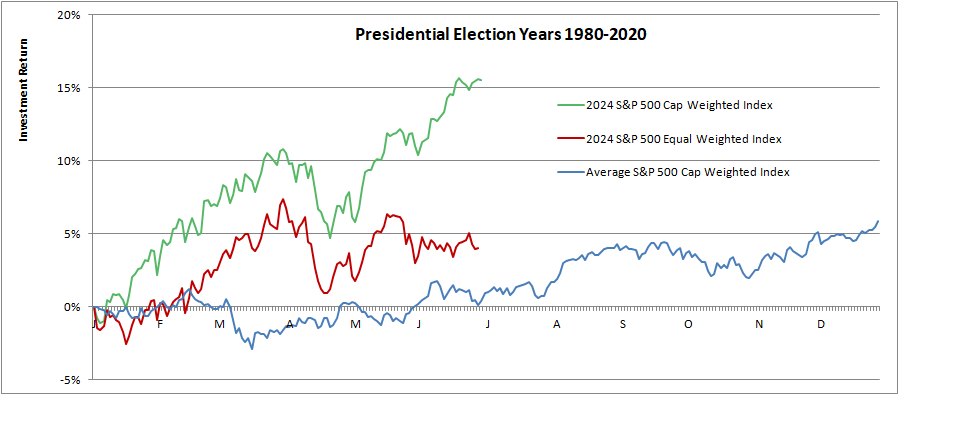
Since the beginning of the year, the cap-weighted index has outperformed the average large stock, represented by the equal weighted index. This is primarily due to investor interest in the "Magnificent 7" technology stocks which dominate the cap-weighted index. (The technology index increased by almost 20%.) Since the smaller equal-weighted stocks typically their larger cousins in good times, this suggests that the market may be beginning to reflect some internal stress. But history suggests that over time the two index versions will equalize again, meaning that smaller companies either will outperform or larger companies will lag. A comparison to the usual election year performance suggests that equalization is most likely to come at the expense of either the over-valued stocks, or possibly both groups. The answer to the questions raised earlier is that both indexes are real and reliable, but they may be currently highlighting a dichotomy in the market which may portend some instability. Time will tell.

David C. Linnard, MBA, CFP®
President
LINNARD FINANCIAL MANAGEMENT & PLANNING, INC.
46 CHESTER ROAD
BOXBOROUGH, MA 01719

Barbara V. Linnard
Vice President
LFMP@LINNARDFINANCIAL.COM
WWW. LINNARDFINANCIAL.COM
978-266-2958
 |
 |
 |
A Registered Investment Advisor and NAPFA-Registered Financial Advisor


The contents of Outlook & Trends reflects the general opinions of LFM&P, which may change at any time, and is not intended to provide investment or planning advice. Such advice is only provided by means of individual agreement with LFM&P.