 Menu
Menu
Menu
Menu
Linnard Financial Management & Planning, Inc.
Fee-Only Financial Planning and Investment Advisor
January 1, 2026
The stock market seems to agree with Mae West when she said, "Too much of a good thing is wonderful." Despite a litany of risks, the stock market posted new highs during the quarter.
Reports about the economy continue to be oddly mixed. Their clarity could have been adversely affected by the government shutdown and the furlough of the data keepers. Oddly, leading indicators, consumer confidence, and employment all softened while GDP was reported as growing significantly at annual rate of 4.3%. Anecdotal evidence from the Fed’s Beige Book report tended to confirm the majority of the statistics. It observed conditions to be largely unchanged, with overall consumer spending declining. Likewise, the University of Michigan Consumer Confidence Index is virtually tied with the lowest levels reached over the last 50 years. Leading Economic Indicators continued their descent, which has continued almost uninterrupted since 2022. Meanwhile, the Administration continues to apply pressure to the Fed to reduce interest rates more quickly to head off a recession that so far is invisible. Fed policy has succeeded thus far in bringing inflation down slowly, but consistently, to 2.7%, despite the tariff uncertainties.
Unemployment continues to hover around 4.6%, which is near the lows of the last 50 years. Low consumer confidence suggests that many people consider this to be a poor economy. Perhaps they are comparing it to the recent 2010’s which benefitted from excess government support. It could be instructive to recall the “Misery Index” though. The term was coined during the stagflation episode of the Carter years. The misery level was said to be equal to the inflation rate plus the unemployment rate, which at the time was 22%. Today it is 7.2%. Conditions could be a whole lot worse.
Along with the recent taming of inflation, home prices have stalled. The National Association of Realtors Home Price Index has been muted, with the annual change in home prices of 1.2%, which is less than half the inflation rate. Their companion statistic measuring the country’s home affordability improved by 4% over the last year as incomes rose faster than mortgage obligations. The Northeast was the exception, though, with affordability continuing to drop by 1%.
Precious metals, primarily silver, delivered the best performances of the quarter. November and December, which are typically the best two months of the year for stocks, found the stock indexes ending the period almost where they began. Usual seasonal patterns have not been visible this year, having been interrupted earlier by the tariff shock.
The major force behind the markets for the last several years has been the availability of money due to government deficit spending and Federal Reserve accommodation. The Fed has recently decided to stop soaking up the money that it printed after the pandemic, even though it still carries $2.7 trillion more on its books than before the pandemic. Meanwhile the government is adding another $1.5 trillion annually through deficit spending. Where does all this money go? Into financial inflation, raising the prices of assets like stocks, bonds and gold.
According to most long-term valuation measures, this government extravagance has made stocks more expensive than ever before and is also a major worry. There is much less wiggle room for deficit financing. Interest payments alone have grown to 13% of the Federal budget, equal to defense spending. The metaphorical rock is the ability to sustain (and grow) government spending. The hard-place is the necessity to pay for it. Possible solutions are reducing the value of the debt by increased inflation, increased taxation or reduced services. All these options reduce economic activity, reduce employment, increase inflation and further jeopardize stock market investments. Since these options are not popular, the government has been keeping the process going. It may not be tomorrow, or next month, but at some point, the Mae West economy must end.
West’s famous quotation is correct, up to a point. That is the point where it is necessary to reckon with reality. Nature is governed by impermanence and cyclicality. Most good things have a finite existence. The stock market and other investments are no different. Trends are propelled by the seeds of their own demise and will not last forever.
The graph shows the last 150 years of inflation-adjusted stock price data. Coupled with Robert Shiller’s Cyclically Adjusted Price Earnings (CAPE) ratio, times of extreme overvaluation are clear. In addition, we can clearly see the impact following periods of excess price elevation. The difference between the current CAPE valuation and its mid-line regression trend (2.36 standard deviations) is currently higher than 98.5% of all other times in the last 150 years! There have only been two periods during that span where the current difference was exceeded: 1929 and the “.com” bubble in 1998. It is also instructive to note that stocks fell 84% and 34% percent respectively from the valuation level equivalent to today’s, over periods of 26 and 12 years before they once again recovered to their initial prices.
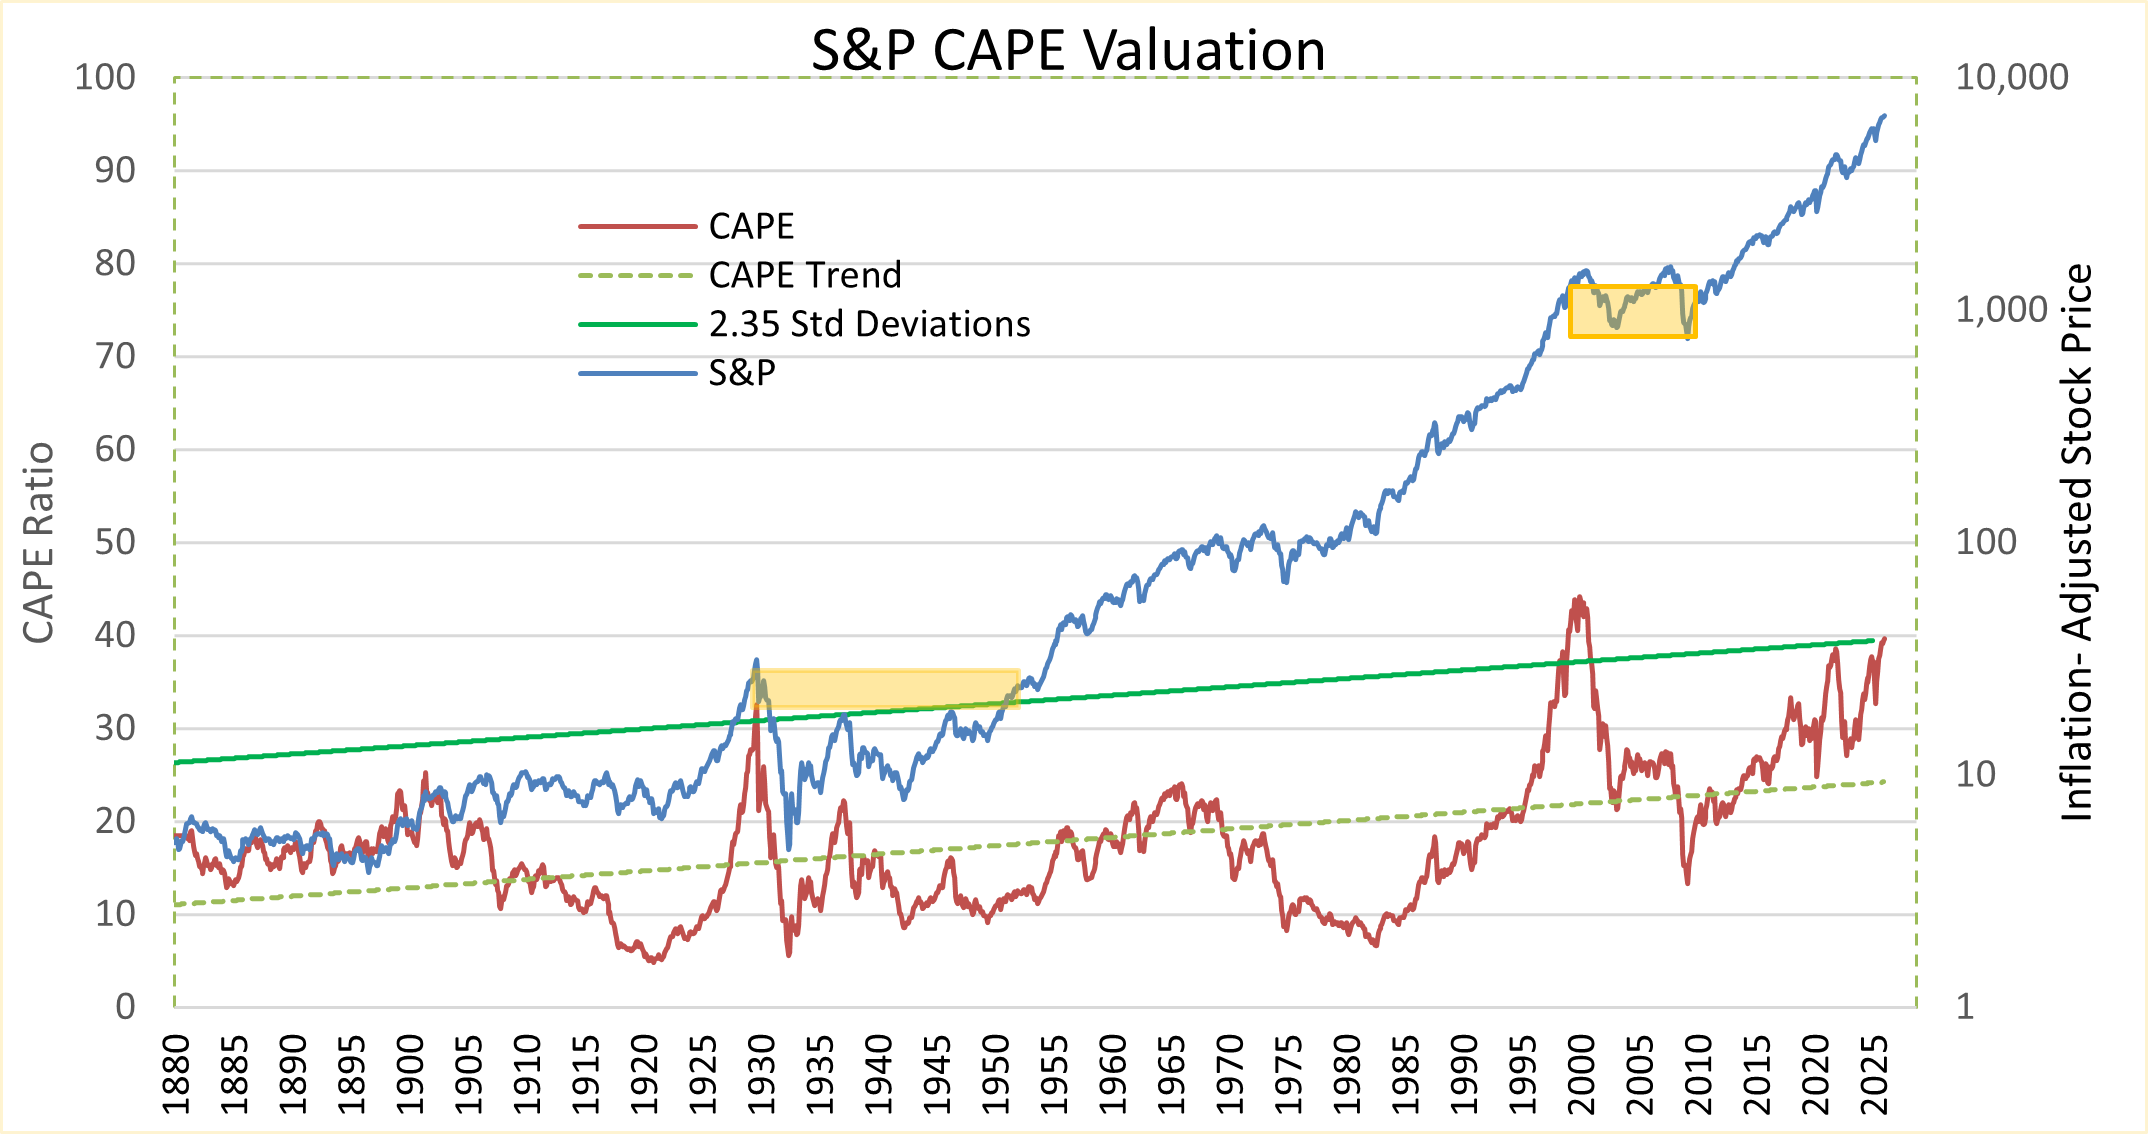
The graph also shows that such a high valuation does not mean that prices will crash tomorrow. In 1998 it took two more years and a further gain of 29% beyond hitting today’s level before stocks rolled over. The strong suggestion, however, is that the current trend will not continue forever, and further gain is likely to be lost. When it ends there is the possibility (or probability) of a significant retracement of the prior advance over the course of a decade or more.
The implications of this chart are the same as we have suggested in past letters:
1) For young people who are comfortable with an aggressive investment posture, the graph shows that stock returns are likely to outpace inflation over the (very) long term and are a good way to save for distant expenses. There could be significant risk over the shorter term, though, like saving for a down payment on a house. It is important to define your goals and the time when the funds will be required and choose suitable vehicles to reach those goals.
2) For those within 10 years of retirement, it is wise to be cautious, keeping the savings that you have. Do not expect that market gains will bail out a retirement plan that is currently lagging. Attacking such a situation aggressively may work, but losses could result in a need to actually postpone retirement, as well as generate emotional stress.
3) For people already in retirement who have a clear plan for earning income with limited risk, it makes sense to be comfortable with that, even if it is not flashy. If you have already gained more wealth over the years than you need to provide your desired lifestyle, then you could afford to take some risk betting that the trend will continue. If not, it does not make much sense to risk the capital you will need to generate your income. A conservative, preservation posture is likely warranted.
The success rate of forecasting the future is low. A strong, conservative plan and structure is the best bet.

David C. Linnard, MBA, CFP®
President
LINNARD FINANCIAL MANAGEMENT & PLANNING, INC.
46 CHESTER ROAD
BOXBOROUGH, MA 01719

Barbara V. Linnard
Vice President
LFMP@LINNARDFINANCIAL.COM
WWW. LINNARDFINANCIAL.COM
978-266-2958

|
A Registered Investment Advisor


The contents of Outlook & Trends reflects the general opinions of LFM&P, which may change at any time, and is not intended to provide investment or planning advice. Such advice is only provided by means of individual agreement with LFM&P.